How IMPIC dramatically saved time with Power BI
Joel Monteiro
- Client IMPIC
- Role Business Intelligence
- Year 2023
The client:
IMPIC (Instituto dos Mercados Públicos do Imobiliário e da Construção) is a Portuguese public institute that carries out attributions in the areas of construction, real estate, and public procurement under the supervision of the Minister of Infrastructure and Housing. IMPIC regulates and inspects the construction and real estate sector, promoting, supervising, and regulating the activities carried out in this sector, producing statistical information and sectoral analysis, and ensuring the coordinated action of the state in the sector, as well as the regulation of public contracts.
The challenge:
IMPIC collects several indicators of vital importance to the housing market in Portugal. Indicators related to transparency, environmental impact, sustainability, or turnover are covered in a report IMPIC produces every month with public procurement data, plus a larger report published at the end of the year. These reports give the Government and the European Commission a detailed overview of the housing market in Portugal and support strategic decisions.
IMPIC collected data for these reports at a database level and processed it through multiple Access and Excel sources. As for the reports themselves, they were produced in Word documents that mixed text and graphics copied from Excel. All things considered, delivering the reports was a tremendous and continuous human effort. An entire week was devoted to manually producing each month’s report due to the amount of data and people involved. As for the much larger annual report, IMPIC estimates they spent almost two whole months working on it.
The institute knew something had to drastically change, but they weren’t equipped with the necessary tools and knowledge to turn things around. IMPIC wanted to analyze the data it collected, generate value, extract knowledge, and automate a large part of its report production process. Having received Power BI training from DevScope in 2017, IMPIC was aware that Microsoft’s Business Intelligence tool and our team’s experience could help them achieve that.
The solution:
IMPIC monitors the management of public procurement, which meant we had to analyze indicators such as the number of tenders, contract awarding, tender prices, etc. This required a layer on top of the original database, so the project started with the assembly of an ETL framework in Power BI that worked alongside a SQL database that replicates data from Portal BASE, a website where information on public contracts celebrated in Portugal is published.
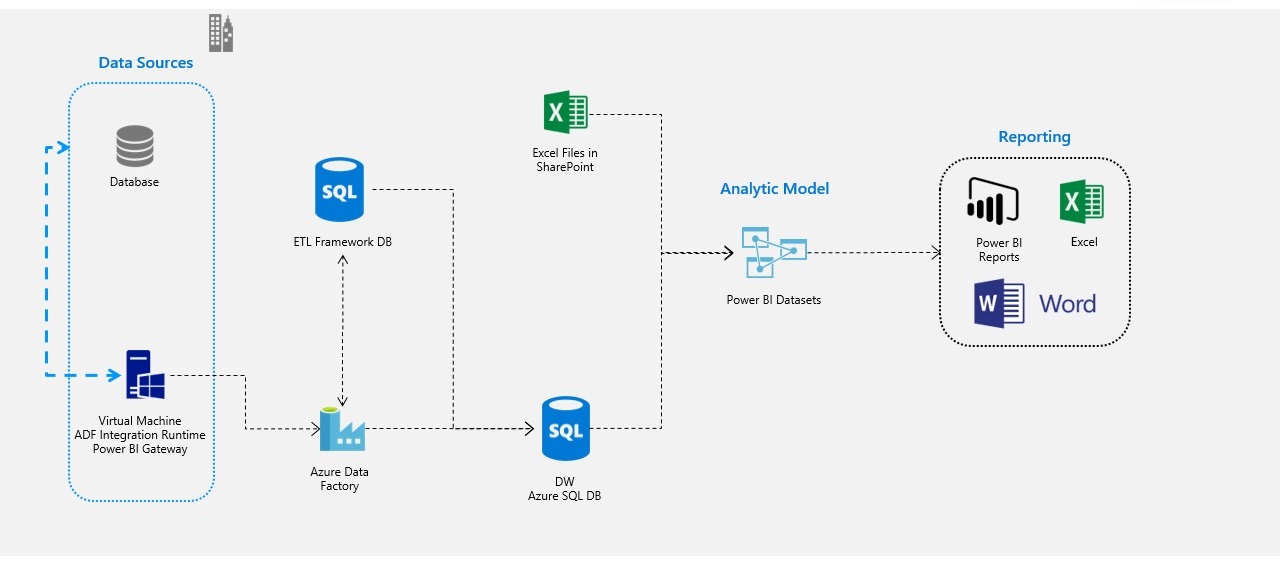
Additionally, we connected IMPIC to Informa D&B, a company that collects data on the enterprise network, and INE, Portugal’s office for national statistics. Because data at this point was immense, some of it was bound to be of low quality, so we spent some time converting, structuring, and treating it.
“We had static indicators, which we fed manually. We would go 6 months without feeding them because our team didn’t have the capacity to do so. What DevScope did was generate real-time indicators and create enormous value in the way of visualizing data to the public through Portal BASE.”
– Cláudia Guerreiro, Senior Technician at IMPIC
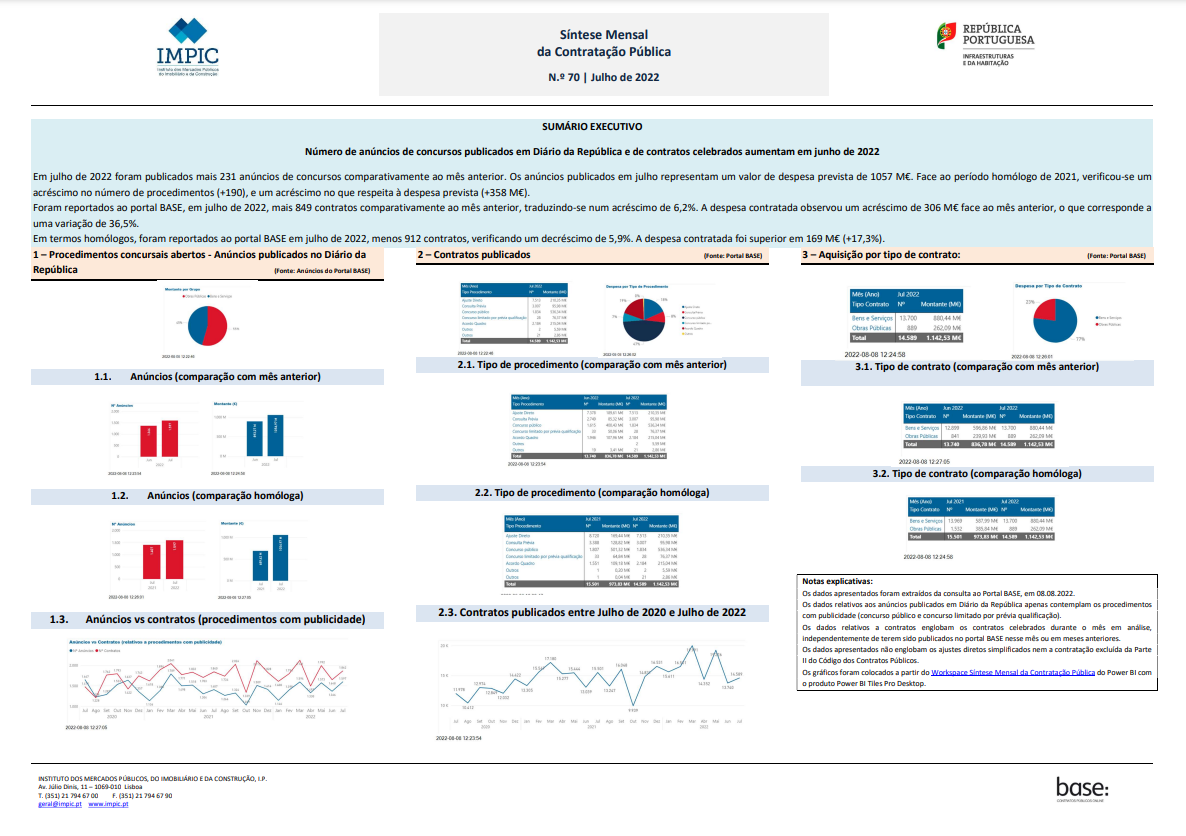
The ETL framework synchronizes at night and several reports are in place collecting the values IMPIC needs for its monthly reports. At the start of each month, a report is automatically generated featuring the data from the previous one. The monthly and annual reports are available to anyone who visits IMPIC’s website and Portal BASE.
The automatic reports generated by Power BI have also been integrated into Word thanks to PowerBI Tiles Pro, which allows users to insert reports and dashboards directly into Word. IMPIC used to take screenshots of Excel graphics and paste them into the document, so access to high-quality screenshots of Power BI reports without leaving Word was another time saver for the institute.
To further reduce manual labor for IMPIC, our team also worked on several public Power BI reports, available on Portal BASE, which replaced manually introduced statistic indicators with automatic ones updated daily. These include indicators on the Portal BASE itself, contracting identities, special contracting measures, and environmental criteria. All were designed with vertical navigation in mind.
Results:
With DevScope’s ETL framework and Power BI, IMPIC’s annual report now takes 2 weeks to put together instead of 2 months. A monthly overview report is generated in a single day instead of taking a whole week to produce.
We went from 1, 2, 3 weeks to 1 day or 2!”
– Cláudia Guerreiro, Senior Technician at IMPIC
PowerBI Tiles Pro was also essential to achieve these results. Now, all IMPIC needs to do is generate a new Word template, use PowerBI Tiles Pro to insert the monthly reports and validate the data afterward. IMPIC has plans to increase their use of Power BI and its team is still receiving ongoing training.
“Generating the report through PowerBI Tiles is easier than copy/pasting 1.000x into Word and without the level of human error that this generates.”
– Cláudia Guerreiro, Senior Technician at IMPIC
IMPIC’s reports are essential to understanding the housing sector in Portugal. Their research scope covers thousands of people and organizations and is used by the Portuguese Government and the European Commission to analyze people’s access to homes and make strategic decisions for the sector. Those reports are now delivered faster than ever and paint a better and more actual picture of housing in Portugal.
What we did:
- Assembled an ETL framework on Power BI and connected several public and private databases to it.
- Improved the quality of data extracted by IMPIC by converting, structuring, and treating it.
- Automated IMPIC’s Power BI reports and integrated them in Word with PowerBI Tiles Pro, dramatically reducing the time IMPIC spent producing monthly and annual reports.
Technologies used: